Debugging WordPress themes can seem daunting, but it’s essential for maintaining your site’s performance, functionality, and security. Here’s a quick breakdown of what you need to know:
- Why It Matters: Fixing errors improves reliability, speeds up loading times, and ensures compatibility with updates.
- Common Issues: PHP errors, CSS conflicts, JavaScript bugs, plugin incompatibilities, and mobile responsiveness failures.
- Safe Debugging: Always use a local environment (e.g., XAMPP, MAMP, or Local) and create backups before making changes.
- Key Tools: Enable WordPress debugging constants like
WP_DEBUGand use plugins like Query Monitor or Debug Bar. - Testing: Validate fixes across browsers, devices, and WordPress standards using tools like Theme Check or PHP_CodeSniffer.
For persistent or complex problems, don’t hesitate to seek professional support. Addressing issues early prevents them from escalating and ensures your site runs smoothly.
Part 54 – WordPress Theme Development – How to Debug Something Broken
Setting Up a Safe Debugging Environment
Debugging directly on your live website is a risky move that can lead to unexpected downtime or errors. Instead, setting up a safe debugging environment ensures your website remains secure while giving you the freedom to troubleshoot without fear. This step lays the groundwork for effective theme debugging and connects seamlessly with the technical steps outlined later.
Using Local Development Environments
A local development environment lets you run WordPress on your computer, essentially creating a replica of your website. This allows you to test changes, tweak code, and debug issues without touching your live site.
For Windows, XAMPP is a popular choice. It bundles Apache, MySQL, and PHP, and you can get it up and running in just a few minutes. If you’re on a Mac, MAMP provides similar functionality with a user-friendly interface tailored for macOS users.
Another great tool is Local by Flywheel (now simply called Local). It simplifies the process of creating WordPress installations, automatically manages SSL certificates, and even includes built-in debugging tools. Plus, it lets you switch between PHP versions effortlessly – perfect for testing theme compatibility.
If you’re comfortable with containerized solutions, Docker-based tools like DevKinsta provide realistic environments, although they come with a steeper learning curve.
To ensure your debugging efforts translate smoothly to your live site, make sure your local environment matches your server’s PHP version, extensions, and settings.
Creating Backups Before Debugging
Even in a controlled local environment, backups are your safety net when experimenting with changes. They ensure you can recover your work if something goes wrong during debugging.
Start by creating database backups using tools like phpMyAdmin or mysqldump. Then, make file-level backups of your entire WordPress installation, including themes, plugins, and configuration files. Debugging can sometimes involve changes to critical files like .htaccess or wp-config.php, so having backups ensures you can restore functionality quickly.
Consider automated solutions like UpdraftPlus to schedule regular backups during your debugging sessions. Following the 3-2-1 rule is a smart approach: keep three copies of your data, store them on two different types of media, and ensure one copy is kept offsite.
Using Child Themes for Customizations
Once your testing environment is ready, it’s essential to protect your customizations. This is where child themes come into play. They act as a buffer between your changes and the parent theme, making debugging more organized and less risky.
Setting up a child theme is straightforward. Create a new folder in your themes directory, add a style.css file with a header pointing to the parent theme, and include a functions.php file for any custom PHP code.
Child themes make debugging easier because they isolate your customizations. Instead of digging through the parent theme’s code, you can focus on just the changes you’ve made.
For even more control, consider integrating version control systems like Git with your child theme. This allows you to track every change, experiment with different fixes using branches, and roll back specific modifications without affecting the entire theme. If you suspect an issue with a particular customization, you can temporarily disable it by commenting out code or renaming files to test its impact without disrupting the rest of your work.
Enabling WordPress Debugging Tools
Once you’ve set up a secure testing environment, the next step is to activate WordPress debugging tools. These built-in features, though disabled by default, can turn vague errors into actionable insights, making it easier to identify and fix issues with your theme.
Activating WP_DEBUG and Related Constants
To get started with WordPress debugging, you’ll need to edit the wp-config.php file. Locate the line define('WP_DEBUG', false); and change it to define('WP_DEBUG', true);. This enables basic error reporting, but keep in mind that errors will be displayed directly on your site, which might disrupt its appearance.
For a more controlled debugging process, add the following lines to the same file:
define('WP_DEBUG_LOG', true);saves errors to a log file located at/wp-content/debug.log.define('WP_DEBUG_DISPLAY', false);prevents errors from being shown on your site while still logging them.define('SCRIPT_DEBUG', true);forces WordPress to use unminified versions of files, making it easier to trace issues in scripts.
Here’s how your debugging setup should look:
define('WP_DEBUG', true); define('WP_DEBUG_LOG', true); define('WP_DEBUG_DISPLAY', false); define('SCRIPT_DEBUG', true); After making these changes, check the debug.log file in the /wp-content/ directory to review any errors.
Using Debugging Plugins
While WordPress’s built-in tools are useful, debugging plugins can provide more detailed insights into your theme’s performance and behavior. These plugins offer visual interfaces that simplify the debugging process.
- Query Monitor: This plugin provides a detailed breakdown of database queries, PHP errors, HTTP requests, and template usage, all displayed in an intuitive panel.
- Debug Bar: Adds a debugging menu to the WordPress admin bar, organizing PHP warnings and errors for easy access.
- Debug Bar JavaScript: Ideal for JavaScript-heavy themes, this plugin captures JavaScript errors and console messages.
It’s important to use these plugins only in your development environment. They consume extra server resources and may expose sensitive information. Once you’ve gathered the necessary data, disable and uninstall these plugins to maintain your site’s security and performance.
Disabling Debugging Features After Use
Debugging tools can pose security and performance risks if left active on a live site. Always turn them off before deploying your theme changes to production.
Large log files can slow down your site, and the debug.log file is often accessible via a direct URL, which could expose sensitive details about your site’s structure. To disable debugging, edit the wp-config.php file and set all debugging constants back to false:
define('WP_DEBUG', false); define('WP_DEBUG_LOG', false); define('WP_DEBUG_DISPLAY', false); define('SCRIPT_DEBUG', false); Additionally, delete any existing debug.log files from the /wp-content/ directory and deactivate any debugging plugins like Query Monitor or Debug Bar.
For ongoing debugging without compromising your live site, consider using a staging environment. This setup replicates your production site while allowing debugging tools to remain active. If you must debug directly on a live site, enable these tools only for the shortest time possible, monitor the log file size carefully, and disable everything as soon as you’ve resolved the issue.
Error Logging and Troubleshooting Methods
Fixing theme issues often requires a thoughtful approach that combines analyzing server logs and leveraging browser tools. Let’s break down how to tackle these problems effectively.
Using Debug Logs to Track Errors
When WordPress debugging is turned on, the debug.log file becomes your go-to resource for uncovering issues. This file captures PHP errors, warnings, and notices, giving you a clear path to the source of the problem.
Each entry in the log provides crucial details like a timestamp, error type, and the file location causing the issue. For example:
[Sep 11, 2025 2:23:45 PM UTC] PHP Fatal error: Call to undefined function get_custom_field() in /wp-content/themes/your-theme/functions.php on line 42
This kind of message pinpoints exactly where the error originates, allowing you to zero in on the issue.
Fatal errors, like the one above, can completely halt your site. These are often caused by syntax errors, missing functions, or incompatible code. They demand immediate attention.
Pay close attention to recurring errors in the log. For instance, if a single error appears hundreds of times, it might indicate a function is being repeatedly called on every page load. Fixing such high-frequency issues can significantly improve your site’s performance.
Focus primarily on errors related to your active theme directory. Errors from plugins or WordPress core files might not be relevant to your theme debugging. To keep your debugging process efficient, clear the log periodically so you’re not overwhelmed by outdated entries.
Once you’ve gathered insights from the debug log, shift your focus to front-end troubleshooting with browser developer tools.
Browser Developer Tools for Front-End Debugging
Modern browsers come equipped with powerful developer tools that can help you diagnose issues with CSS, JavaScript, and network requests.
- Console Tab: This is where JavaScript errors are displayed. Look for red error messages – they often indicate broken scripts, missing files, or syntax problems in your theme’s JavaScript. Yellow warnings highlight deprecated functions or minor issues that, while not critical, are worth addressing.
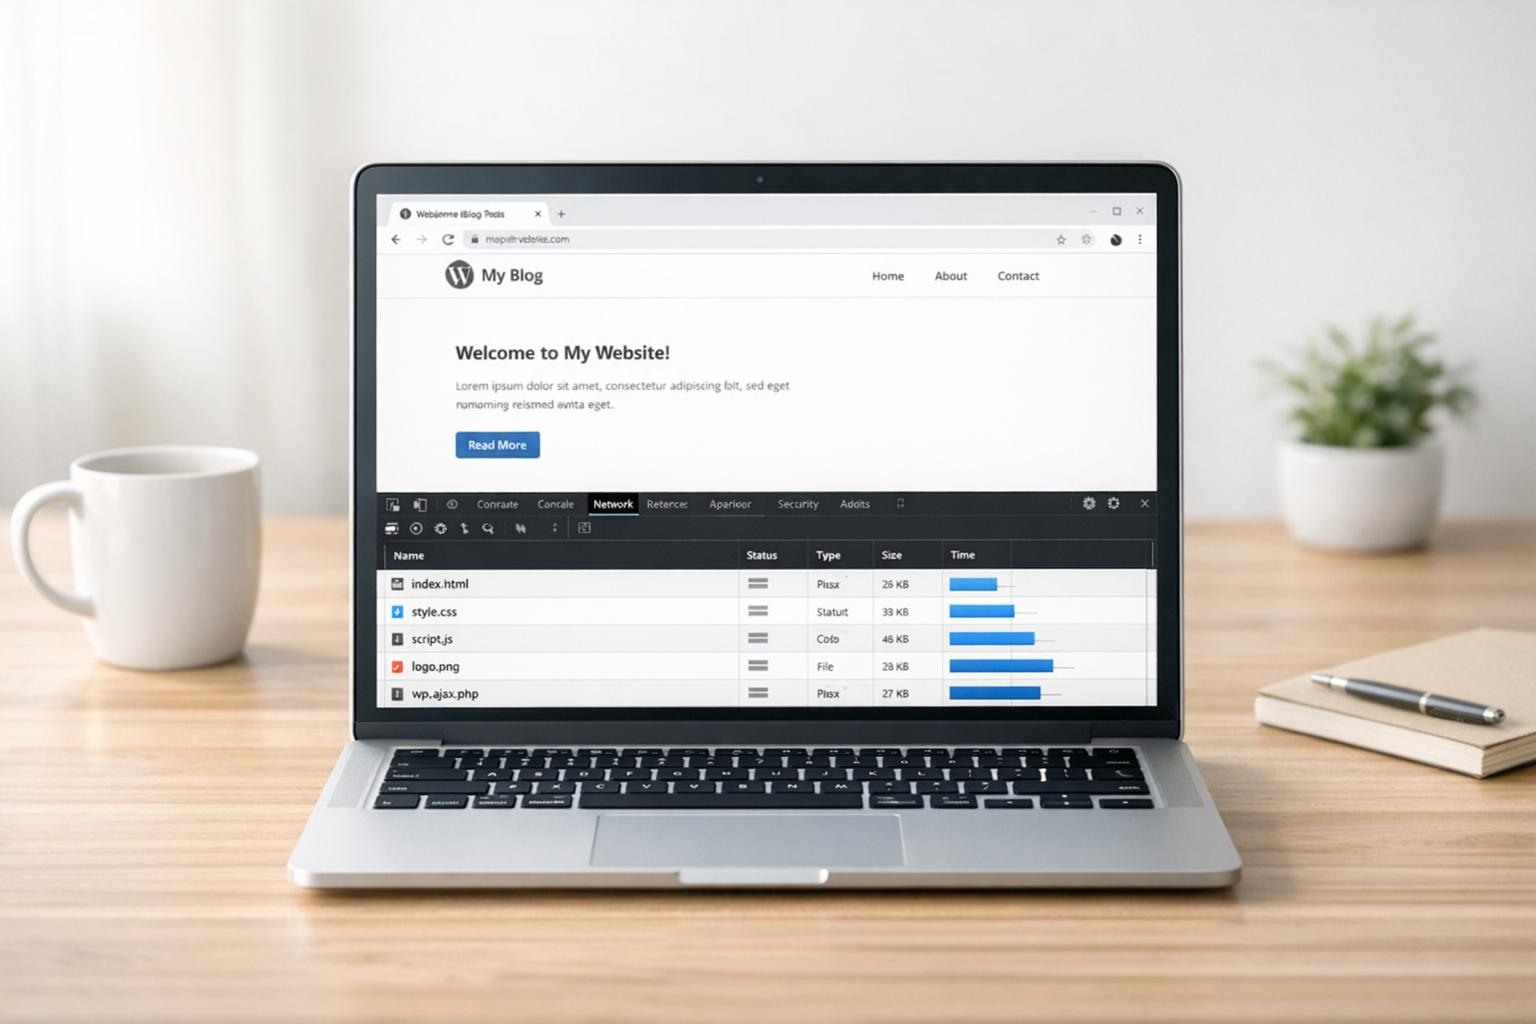
- Network Tab: This tab provides a list of all the files your theme loads, such as stylesheets, scripts, and images. Failed requests (marked in red) often point to missing files or incorrect paths, helping you identify misdirected theme assets.
- Elements Tab: Use this to inspect your theme’s HTML structure and CSS styles. You can modify CSS directly in the browser to test fixes before applying them to your theme files. The Computed panel is especially helpful for resolving CSS conflicts by showing which rules are applied and where overrides occur.
- Sources Tab: This feature allows you to set breakpoints in JavaScript code, making it possible to step through the code line by line. It’s particularly useful for debugging complex functionality like custom sliders, form validation, or AJAX requests.
Additionally, developer tools include a mobile device simulation mode. This lets you test your theme’s responsiveness and uncover design issues that might not be obvious on a desktop browser.
Once you’ve addressed front-end issues, it’s time to isolate the root cause by testing plugins and switching themes.
Isolating Issues with Plugins and Default Themes
If front-end debugging doesn’t resolve the problem, the next step is to figure out whether plugins or WordPress core files are involved. Sometimes what appears to be a theme issue might actually be caused by a plugin or server configuration.
Start by temporarily deactivating all plugins. If the problem disappears, you’ve confirmed it’s plugin-related. Reactivate plugins one at a time until the issue reappears – this will pinpoint the conflicting plugin.
Another helpful strategy is to switch to a default WordPress theme, such as Twenty Twenty-Four. If the issue resolves, the problem is likely theme-related. If it persists, the cause might lie elsewhere, like in plugins, server settings, or WordPress core files.
For multisite installations, test the same theme across multiple sites in your network. If the issue shows up on all sites, it’s likely a theme problem. If it’s limited to one site, the issue might be tied to that site’s specific configuration.
Finally, consider your server environment. If an issue occurs on your live site but not in your local development setup, it could be due to differences in server configuration, PHP versions, or memory limits. In such cases, reaching out to your hosting provider can help resolve the problem.
sbb-itb-976b402
Testing and Validating Theme Changes
Once you’ve identified and fixed theme issues, the next step is making sure those changes work seamlessly across different environments while meeting WordPress standards. This process helps maintain your site’s quality and prevents new problems from cropping up down the line.
Cross-Browser and Device Testing
Just because your theme looks flawless in one browser on your desktop doesn’t mean every visitor will have the same experience. Different browsers – like Chrome, Safari, Firefox, and Edge – can handle modern CSS features such as CSS Grid, flexbox, and custom fonts in unique ways. Testing across these platforms ensures consistency.
Mobile testing is equally important since a significant portion of web traffic comes from mobile devices. Testing on actual mobile devices, rather than just emulators, can help you catch platform-specific layout quirks and performance issues.
Tablets, which sit between mobile and desktop experiences, also need attention. Navigation, image scaling, and layout should all function smoothly on these devices. Keep in mind that performance matters – a theme that loads quickly on a high-performance laptop might lag on a budget smartphone with limited resources. Thorough testing across devices ensures a consistent and enjoyable experience for all users.
After ensuring cross-browser and device compatibility, validate your theme’s code to meet WordPress standards for security and performance.
Validating Code Against WordPress Standards
Once errors are fixed, it’s essential to check that your code aligns with WordPress standards. Following these guidelines ensures your theme works seamlessly with the platform and remains secure.
Tools like Theme Check, Theme Sniffer, PHP_CodeSniffer, and Log Deprecated Notices can help you validate your code. These tools scan for violations of WordPress standards and flag any issues automatically.
Enable WP_DEBUG during development to catch errors in real time. Many modern code editors, such as Visual Studio Code, support extensions that integrate these validation tools directly into your workflow. For example, searching for "phpcs" extensions can help you spot coding violations as you work. Additionally, tools like SonarLint can identify security vulnerabilities in real time and support editors like Visual Studio Code, JetBrains, and Eclipse.
Manual vs. Automated Testing
After validating your code, systematic testing ensures your theme changes function properly in real-world scenarios. Both manual and automated testing play vital roles, and knowing when to use each can save time and effort.
| Testing Aspect | Manual Testing | Automated Testing |
|---|---|---|
| User Experience | Ideal for spotting subtle design or usability issues | Limited to functional checks; cannot evaluate visual appeal |
| Speed and Efficiency | Time-intensive for repetitive tasks across browsers and devices | Fast execution; runs multiple tests in minutes once set up |
| Coverage | May miss edge cases or specific scenarios due to human error | Consistently tests the same scenarios, ensuring reliable coverage |
| Cost | Relies only on time and human effort, with no extra tool expenses | May require upfront costs for tools but saves time in the long run |
| Flexibility | Can adapt testing parameters based on real-world observations | Follows pre-written scripts and may overlook unexpected issues |
Manual testing is best for catching subtle design flaws or interactive challenges that automated tools might miss. On the other hand, automated testing excels at repetitive tasks, ensuring consistency across multiple environments.
A hybrid approach often works best: start with automated tools to identify obvious issues, then use manual testing to fine-tune the user experience and design. This combination strengthens the reliability of your theme updates and ensures they align with the broader debugging strategy.
Getting Professional Support for Complex Issues
Sometimes, the usual troubleshooting methods just aren’t enough. When you’re facing complex PHP errors, security threats, or stubborn performance problems, it’s time to call in the experts.
When to Seek Professional Help
There are certain situations where professional intervention isn’t just helpful – it’s necessary. For example, complex PHP errors or security breaches often require advanced technical knowledge to resolve. Similarly, if your site is experiencing persistent issues that standard diagnostics haven’t been able to fix, it’s a strong sign you need expert assistance.
Another key reason to seek help is when your business is feeling the impact of time-sensitive issues. If downtime or slow performance is disrupting operations or costing you customers, a quick resolution becomes essential. These situations often demand more time and expertise than you may have available.
Even if you’ve gone through all the usual steps – like disabling plugins, switching themes, checking error logs, and using WordPress recovery mode – but the problem remains, it’s time to escalate. Standard diagnostic steps failing is a clear indicator that advanced troubleshooting is needed.
Don’t let limited technical expertise hold you back. Tasks like modifying core files, working with databases, or handling complex debugging can be risky if you’re not experienced. Professional developers can manage these challenges safely and effectively, saving you from potential mistakes.
Sometimes, host-level limitations can also force your hand. Hosting providers may only offer basic support, leaving deeper code issues unresolved. If you need server configuration changes or advanced fixes outside their scope, specialized WordPress support services can step in.
When problems go beyond routine fixes, it’s often best to rely on professionals who have the tools and expertise to get your site back on track.
How WP Support Specialists Can Help

This is where WP Support Specialists come into play. They’re equipped to handle the advanced challenges that standard troubleshooting can’t resolve. From emergency PHP fixes to security cleanups and performance tuning, their team offers a range of services tailored to your needs.
One of their standout features is their emergency support plan, which guarantees a 6-hour response time for critical issues. This is particularly valuable when theme or plugin problems are causing serious disruptions to your business.
For more complex needs, their team also offers custom solutions. Whether it’s developing a custom plugin or making advanced theme modifications, they can create tailored fixes to address specific functionality requirements that go beyond standard troubleshooting.
Additionally, their structured maintenance plans provide ongoing support to keep your site running smoothly. Regular monitoring helps catch potential problems early, often preventing the need for emergency intervention altogether. These plans also include malware monitoring and proactive updates, ensuring your site stays secure and stable.
Whether you’re dealing with an urgent issue or looking for long-term stability, WP Support Specialists offer the expertise and reliability you need to keep your site in top shape.
Conclusion
Debugging WordPress themes isn’t just about resolving immediate issues – it’s about creating a structured process that keeps your site running smoothly and prevents minor glitches from turning into major headaches. The strategies outlined in this guide are essential for maintaining and developing WordPress sites professionally.
Using a local development environment shields your live site from disruptions, avoiding costly downtime or errors that could impact visitors. Remember to activate WP_DEBUG only during development to prevent exposing sensitive data to the public.
Error logging takes the guesswork out of debugging. By reviewing logs of PHP errors and deprecated functions, you can pinpoint the source of problems and confirm that your fixes are effective. Once you’ve verified your fixes through logs, move on to thorough testing.
Testing your changes across various browsers and devices ensures that your fixes don’t unintentionally create new problems. For example, something that works flawlessly in Chrome on a desktop might fail in Safari on a mobile device. Comprehensive testing is critical for delivering a seamless user experience.
Key Takeaways
Here’s a quick recap of the essential practices for effective theme debugging:
- Set up safe environments and backup systems before making changes.
- Use WordPress debugging tools and analyze error logs.
- Test fixes across multiple platforms and devices.
- Seek professional help for complex or persistent issues.
Utilizing child themes is another smart move. They let you customize and test without altering the core theme files, making it easier to revert changes or safely update the parent theme. This approach simplifies debugging and ensures smoother long-term maintenance.
Automated tools like Theme Check and Theme Sniffer can quickly identify coding standard violations and potential issues, helping you maintain cleaner, more reliable code that’s easier to troubleshoot in the future.
For more complex challenges – like persistent PHP errors or security breaches – turning to experts is often the best solution. Services such as WP Support Specialists offer specialized knowledge and emergency support to keep your site secure and functional when standard debugging methods fall short.
FAQs
What’s the difference between using a local development environment and a staging environment to debug WordPress themes?
A local development environment is installed directly on your computer, giving you a private space to work without affecting the live website. It’s perfect for building, testing, and debugging WordPress themes at your own pace, with complete control. This setup is particularly handy for trying out new features or fixing issues in a contained environment.
Meanwhile, a staging environment is a server-based copy of your live site. It’s used to test updates, new features, or bug fixes in a setting that closely resembles the live site. Staging environments are invaluable for team workflows or testing with real data to make sure everything runs smoothly before changes are applied to the live site.
In essence, local environments are ideal for quick, private development, while staging environments are critical for thorough testing in a realistic, server-like environment.
How can I keep my WordPress theme compatible with future updates after customizing it?
When customizing your WordPress theme, it’s crucial to use a child theme. This approach lets you tweak your site without altering the core files of the parent theme. The big advantage? Your customizations stay safe and intact, even when updates roll out.
Always back up your entire site – this includes your database – before making any updates. To avoid potential hiccups, test all changes in a staging environment first. This way, you can catch and fix issues without risking your live site. Also, keep your themes, plugins, and WordPress core updated regularly. Doing so not only boosts security but also ensures everything works smoothly. Just be mindful to follow best practices to prevent overwriting your custom changes.
What should I do if debugging in my local environment doesn’t fix issues on my live WordPress site?
If fixing issues in your local environment doesn’t solve the problems on your live site, the first step is to verify that the migration process was completed accurately. Make sure all files and the database were transferred without any errors. Also, check that environment-specific settings – like URLs and database configurations – have been properly updated.
It’s a good idea to test your site in a staging environment before making it live. This provides a controlled space to catch and address potential problems, helping to ensure a smoother launch. If issues continue, reaching out to a WordPress specialist can provide the expert troubleshooting and support you might need.