Debugging WordPress themes is about identifying and fixing errors in your theme’s code to ensure your site runs smoothly. Common issues include PHP syntax errors, JavaScript conflicts, CSS display problems, and database query errors. The process often starts by enabling WordPress debugging tools like WP_DEBUG to expose hidden errors.
Here’s the quick breakdown of what you need to know:
- Enable Debugging: Modify your
wp-config.phpfile to activateWP_DEBUG,WP_DEBUG_LOG, and other constants. - Use Staging Environment: Test changes safely without affecting your live site.
- Check Error Logs: Review the
debug.logfile for PHP issues and use browser developer tools for JavaScript and CSS problems. - Disable Plugins/Themes: Turn off plugins or switch to a default theme to isolate the issue.
- Advanced Tools: Use plugins like Query Monitor or Debug Bar for detailed insights. For deeper analysis, configure Xdebug to debug PHP code step-by-step.
If problems persist, consider seeking professional help to avoid downtime or data loss. Regular maintenance and backups can also prevent future issues.
Part 54 – WordPress Theme Development – How to Debug Something Broken
Setting Up Your Debugging Environment
Having the right debugging setup can help you quickly identify and fix theme errors without putting your live site at risk. Start by configuring your wp-config.php file to enable WordPress debugging features.
Using WP_DEBUG and Related Constants
In your site’s root wp-config.php file, enabling debugging can reveal hidden errors. Locate the line that says /* That's all, stop editing! Happy publishing. */ and add the following constants just above it:
- WP_DEBUG: This is the main switch for WordPress debugging. Set it to
trueto display error messages:define('WP_DEBUG', true); - WP_DEBUG_LOG: This saves all errors to a log file instead of displaying them on the site. It’s a great way to keep error messages hidden from visitors while still having access to them:
define('WP_DEBUG_LOG', true); - WP_DEBUG_DISPLAY: Controls whether errors are shown directly on your website. For live sites, set this to
falseto prevent visitors from seeing these messages:define('WP_DEBUG_DISPLAY', false); - SCRIPT_DEBUG: Forces WordPress to use uncompressed versions of CSS and JavaScript files, making it easier to troubleshoot front-end issues:
define('SCRIPT_DEBUG', true);
When WP_DEBUG_LOG is enabled, WordPress generates a debug.log file in your /wp-content/ directory. This file contains timestamps, error types, and file locations, making it easier to pinpoint the source of a problem.
Using Browser Developer Tools
Modern browsers come equipped with developer tools that can help you diagnose front-end issues. For example, Chrome DevTools provides real-time insights into your site’s performance and errors. Use these features to troubleshoot:
- Console: View JavaScript errors and warnings.
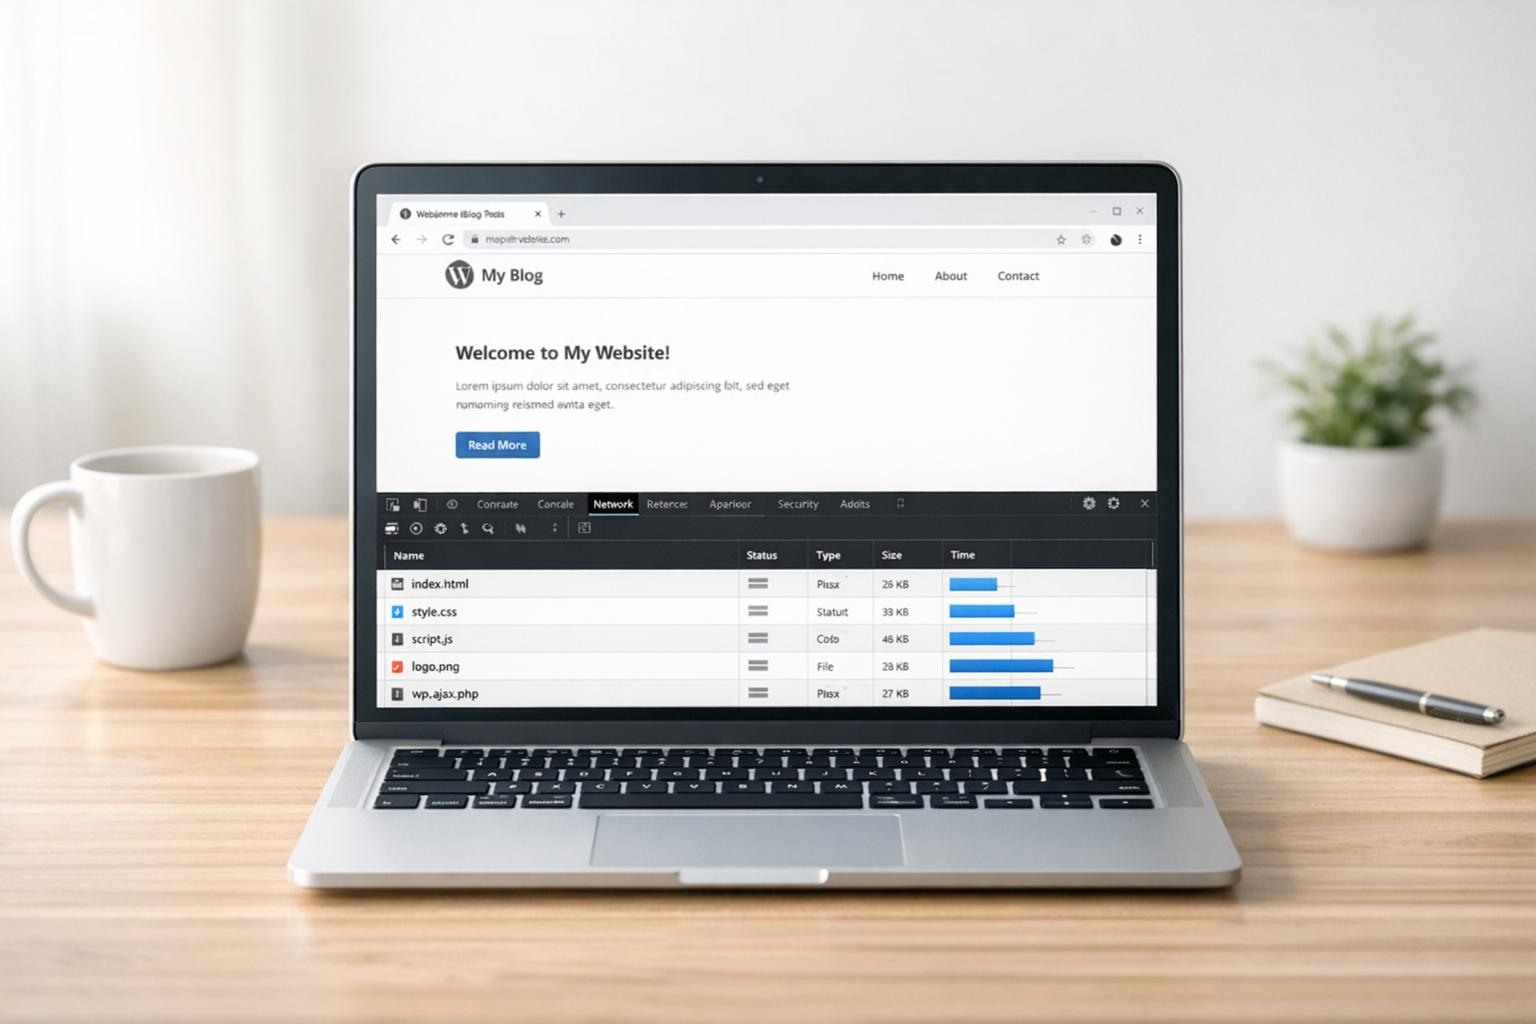
- Network: Check if files are loading properly or if there are any delays.
- Elements: Inspect and modify HTML and CSS on the fly.
- Sources: Set breakpoints and debug JavaScript code.
To access these tools, press F12 or right-click on a page and select “Inspect Element.” Browser developer tools can also reveal 404 errors for missing files, CORS issues with external resources, and performance bottlenecks. These insights don’t just highlight what’s broken – they help you understand why it’s broken and how to resolve it.
For safe testing of fixes, consider using version control practices, as explained below.
Version Control for Safe Updates
Using a version control system like Git is essential when debugging your theme. It helps you track every change made to your files, allowing you to identify what caused a problem and roll back if needed.
Here’s how to get started:
- Initialize Git: In your theme directory, run:
git initThen create a baseline version:
git add . git commit -m "Initial theme version" - Branch for Debugging: Before making changes, create a new branch to isolate your debugging efforts:
git checkout -b debug-session-[date]If things go wrong, you can easily return to your main branch:
git checkout main - Commit Frequently: Save your progress as you debug. For example:
git add . git commit -m "Fixed PHP syntax error in functions.php"Clear commit messages make it easier to track your changes later.
- Use Cloud Storage: Services like GitHub, GitLab, or Bitbucket allow you to back up your repositories online. Push your changes regularly:
git push origin main
Version control is invaluable for complex debugging. With commands like git diff, you can compare file changes, and git log helps you trace when specific issues were introduced. If needed, you can even revert individual files to earlier versions without affecting the rest of your project.
Fixing Common WordPress Theme Errors
Once your debugging environment is ready, it’s time to tackle those pesky theme errors. Many WordPress theme issues follow familiar patterns, and learning how to interpret error messages can save you a lot of time and headaches.
Reading Error Logs and Browser Console
Your debug.log file and browser console are your best friends when it comes to identifying theme errors. Start by checking the /wp-content/debug.log file. PHP errors in this log typically provide three key details: the error type, file location, and line number. Here’s an example of a typical error:
[28-Aug-2025 14:32:15 UTC] PHP Fatal error: Uncaught Error: Call to undefined function get_field() in /wp-content/themes/your-theme/single.php on line 42 This error points to a missing function, likely caused by a deactivated plugin that your theme relies on.
Here are the common PHP error types you might encounter:
- Fatal errors: These completely break your site, often due to missing functions or syntax mistakes.
- Parse errors: Usually caused by typos, like missing semicolons or mismatched brackets.
- Notice errors: Less severe issues that don’t break functionality but indicate coding oversights.
- Warning errors: More serious than notices but won’t crash your site.
For JavaScript errors, open your browser console by pressing F12 and navigating to the Console tab. Common errors like Uncaught TypeError or ReferenceError often highlight problems with your theme’s scripts.
Once you’ve identified the issue, the next step is isolating the cause by disabling plugins or switching themes.
Disabling Plugins and Switching Themes
After reviewing your error logs, the quickest way to pinpoint the issue is by systematically disabling plugins and switching themes. This process helps you figure out whether the problem originates from your theme, a plugin conflict, or WordPress itself.
Start with plugin deactivation. Head to your WordPress admin dashboard and go to Plugins > Installed Plugins. Deactivate all plugins and check if your theme works properly. If the issue is resolved, reactivate the plugins one by one until the problem reappears – this will identify the culprit.
If your site is completely down (e.g., the white screen of death), you’ll need to deactivate plugins using your file manager or an FTP client. Navigate to /wp-content/plugins/ and rename the folder of the suspected plugin by appending -disabled to its name. This automatically deactivates the plugin.
Next, test your theme by switching to a default WordPress theme like Twenty Twenty-Four. If your site works fine with the default theme, the issue lies in your custom theme code.
If these steps don’t resolve the problem, consider using debugging plugins for a deeper analysis.
Using Debugging Plugins
When basic troubleshooting doesn’t cut it, debugging plugins can provide deeper insights into your theme’s performance and errors. One of the most powerful tools for this is Query Monitor, which offers real-time data on your site’s performance.
After installing Query Monitor, you’ll notice a new menu in the admin bar that provides detailed information, including:
- Database Queries: Identifies duplicate or inefficient queries in your theme’s code.
- PHP Errors: Displays errors with a full call stack, helping you trace the issue back to its source.
- Hooks & Actions: Shows which WordPress hooks your theme uses and how long they take to execute.
- JavaScript Debugging: Links console errors with related PHP issues for a clearer picture.
If you’re looking for something simpler, try Debug Bar. This lightweight plugin adds a debugging menu to the admin bar, showing details about SQL queries, cache performance, and PHP warnings. It’s particularly useful for spotting deprecated function calls, which can cause problems in future WordPress updates.
These tools not only help you fix the error but also give you a better understanding of why it happened and how to avoid similar issues down the road.
Advanced Debugging Tools and Methods
Building on earlier techniques, these advanced tools provide the precision needed to tackle even the most challenging theme issues. They save time and turn complex troubleshooting into a more manageable process.
Debugging with Xdebug
Xdebug transforms debugging into a structured, step-by-step process. Instead of relying on error logs and guesswork, Xdebug allows you to pause code execution, inspect variables, and understand what’s happening in real time.
To set up Xdebug, you’ll need to configure three things: your local development environment, your code editor, and a browser extension. If you’re using Local WP (version 6.4.2 or newer), you’ll need to edit the conf/php/php.ini.hbs file in your site’s configuration. The settings depend on your PHP version:
For PHP 7.x with Xdebug 2, add the following:
xdebug.remote_enable=1 xdebug.remote_connect_back=Off xdebug.remote_port="9000" xdebug.profiler_enable=0 For PHP 8.x with Xdebug 3, use this configuration:
xdebug.mode=debug xdebug.client_port="9000" xdebug.discover_client_host=yes After updating the file, restart your Local site. If you’re using Local WP 6.6.1 or newer, enable the Xdebug toggle in the Overview tab.
To confirm Xdebug is active, create a simple PHP file, such as pi.php, with this code:
<?php phpinfo(); ?> Load the file in your browser and look for the Xdebug section. For Xdebug 3, you can use:
<?php xdebug_info(); ?> In VS Code, install the PHP Debug extension by the Xdebug team. Then, create a launch.json file in the .vscode directory of your workspace. Ensure the port matches the one in your php.ini.hbs file (default is 9000).
To debug, set breakpoints in your code by clicking next to the line numbers in your PHP file. Start the debugger in VS Code by pressing F5 – you’ll know it’s active when the bottom of your editor turns orange. Then, use the Xdebug Helper browser extension to activate debugging (its icon will turn green). Load the page that triggers your breakpoint to start debugging.
Once a breakpoint is hit, you can:
- Step Over (F10) to move to the next line.
- Step Into (F11) to dive into a function.
- Step Out (Shift + F11) to exit a function.
The Variables panel will show you the current values of all variables. If your breakpoints aren’t working, check for port conflicts using netstat -an | find "9000" on Windows or sudo netstat -nap | grep ":9000" on Linux/Mac. Change the port in both your php.ini.hbs and launch.json files if needed.
Next, we’ll look at debugging front-end scripts using SCRIPT_DEBUG.
Enabling SCRIPT_DEBUG for Front-End Scripts
By default, WordPress loads minified CSS and JavaScript files to improve performance. While this is great for live sites, it makes debugging front-end issues a nightmare since the compressed code is unreadable.
To make debugging easier, you can enable the SCRIPT_DEBUG constant. Add this line to your wp-config.php file, just above the “That’s all, stop editing!” comment:
define( 'SCRIPT_DEBUG', true ); This forces WordPress to load the uncompressed, development versions of its scripts and styles. Instead of seeing compressed code like function a(b,c){return b+c}, you’ll get properly formatted and commented code that’s much easier to work with.
This is especially useful for debugging JavaScript conflicts between your theme and WordPress core, or understanding how core scripts work to ensure your customizations don’t break anything. It’s also helpful when testing plugins or themes that modify WordPress’s built-in scripts.
Be sure to only use SCRIPT_DEBUG in development or staging environments, as uncompressed files can slow down page load times. Disable it before deploying changes to your live site.
For even more control, you can use custom logging and breakpoints.
Custom Logging and Breakpoints
Custom logging gives you the ability to track specific variables, function calls, or execution paths without pausing code execution like Xdebug does.
Start by enabling WP_DEBUG_LOG in your wp-config.php file. This logs all PHP errors to a debug.log file in your wp-content directory. You can also add your own custom messages using PHP’s error_log() function. For example:
error_log('Reached the custom function in single.php'); For arrays or objects, use a helper function to format the output:
function write_log($log) { if (WP_DEBUG === true) { if (is_array($log) || is_object($log)) { error_log(print_r($log, true)); } else { error_log($log); } } } This function ensures logging only happens when WP_DEBUG is enabled, so it won’t clutter your logs in production. You can use it anywhere in your theme:
write_log($post_data); // Logs the entire post data array write_log('User ID: ' . get_current_user_id()); // Logs specific values For debugging database queries, enable the SAVEQUERIES constant in your wp-config.php file:
define('SAVEQUERIES', true); This stores all queries in the $wpdb->queries array, which you can log or inspect to identify slow or duplicate queries.
Strategic logging can also act as a breadcrumb trail. Place log messages at key points in your code – such as the start and end of functions, before and after database queries, or at critical decision points. This creates a detailed map of your code’s execution, making it easier to pinpoint issues.
These advanced debugging techniques can save you countless hours and help you resolve even the trickiest theme problems.
sbb-itb-976b402
When to Get Professional Help
Even with the best debugging strategies, there are times when tackling issues on your own just isn’t enough. Some problems are too complex or risky to handle without professional expertise, especially when delays could lead to downtime or data loss. Here’s how to recognize when it’s time to call in the pros.
Signs That You Need Expert Help
If you’re dealing with critical errors like a white screen of death, database connection failures, or a completely inaccessible website, it’s time to bring in an expert. These issues can escalate quickly, and professional assistance can help prevent data loss or prolonged outages.
Security concerns are another red flag. If you notice suspicious code injections, unauthorized file changes, or signs of malware, it’s best to let professionals handle the situation. Attempting a DIY fix in these cases can sometimes make things worse, leaving your site vulnerable to further attacks.
Complex technical problems, like conflicts between advanced PHP frameworks, multiple API integrations, or failing custom database functions, often require a deeper level of WordPress expertise. Similarly, if your theme clashes with essential business plugins, resolving the issue might involve custom code modifications that are best left to a professional.
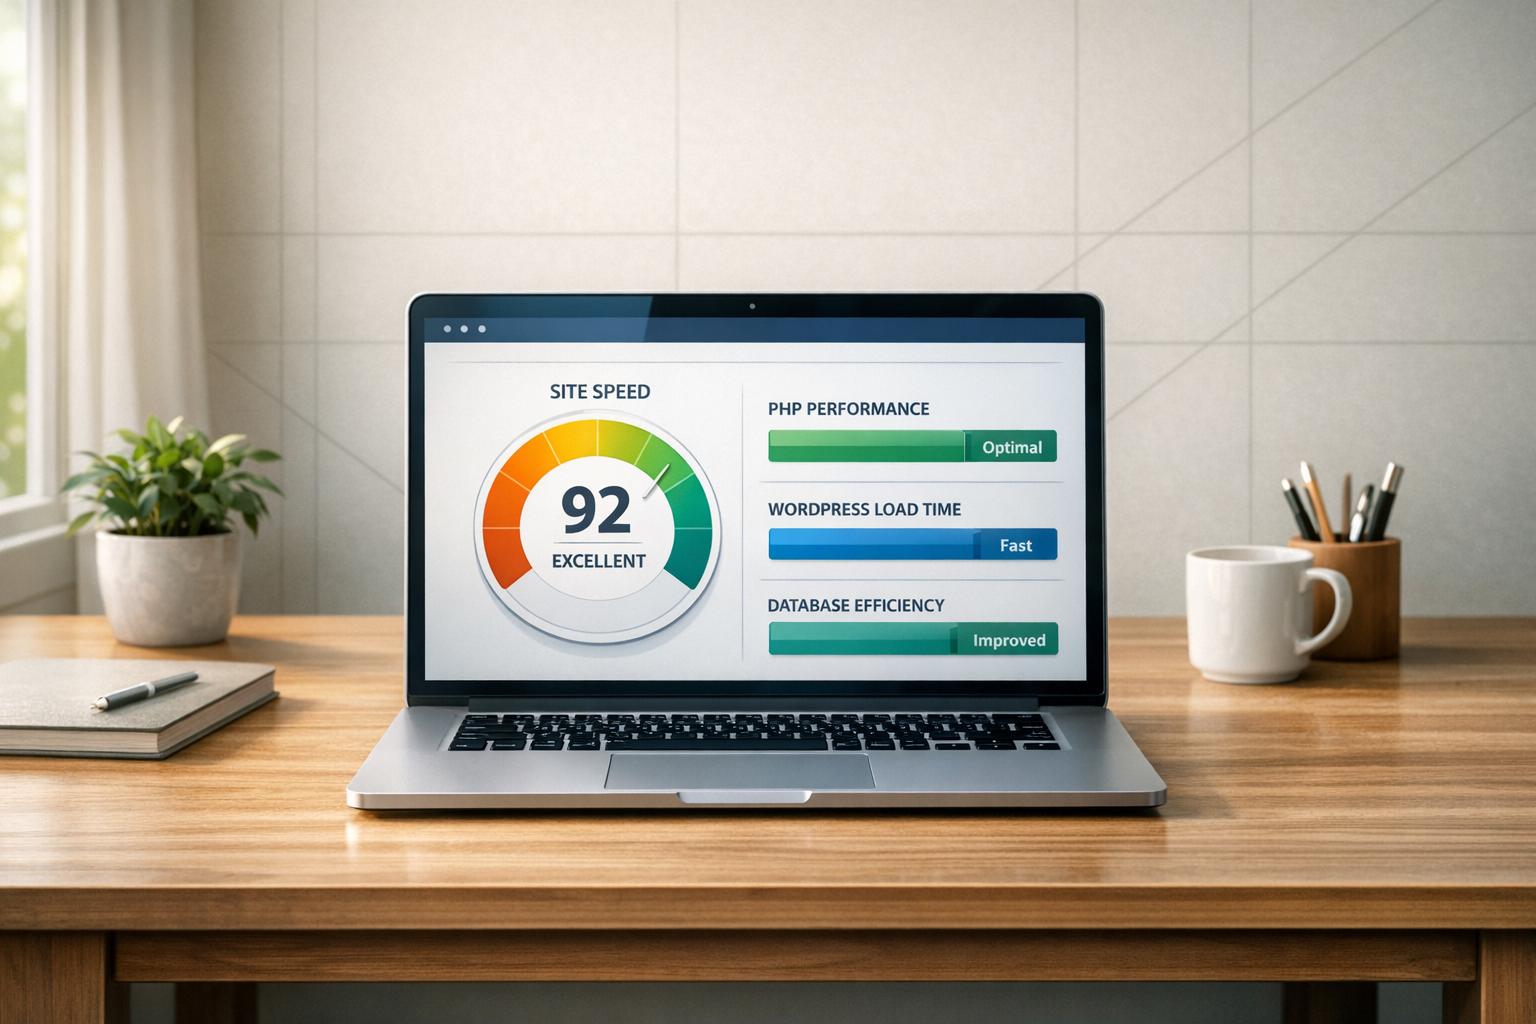
Performance issues that persist despite typical optimizations can also signal deeper problems. Issues like inefficient database queries, poorly written code, or misconfigured server settings might be at play – and those require specialized knowledge to address effectively.
Finally, if technical problems are causing extended downtime and impacting your revenue, it’s essential to act fast and get expert help to minimize the damage.
Services Provided by WP Support Specialists
When these kinds of challenges arise, having access to specialized services can make all the difference. WP Support Specialists focuses solely on WordPress, offering the expertise needed to tackle even the most complex theme-related issues.
For emergency theme fixes, they provide a fast response through their Custom Support & Maintenance plan, which includes a 6-hour response time for critical problems. This quick action can be a lifesaver when your site’s functionality or business operations are at risk.
Their custom plugin development services are ideal for situations where debugging reveals that your theme requires additional features or adjustments beyond basic troubleshooting. Instead of applying temporary patches, they deliver long-lasting solutions that integrate seamlessly with your site.
When security vulnerabilities are uncovered, their security audits and malware removal services come into play. They thoroughly identify threats, remove compromised files, and implement safeguards to protect your site from future attacks.
For agencies managing multiple WordPress sites, their white-label partnership options allow you to offer professional debugging and development services to your clients without needing in-house specialists. Additionally, their migration services are critical when debugging uncovers server compatibility issues or when moving your site to a more reliable hosting environment is necessary.
WP Support Specialists are experts at identifying root causes and delivering effective solutions that improve your site’s performance and stability.
Conclusion
This section brings together the key steps and strategies for debugging WordPress themes effectively.
Key Points from the Debugging Process
To start debugging WordPress themes, you’ll need to enable constants like WP_DEBUG, WP_DEBUG_LOG, and WP_DEBUG_DISPLAY in your wp-config.php file. These settings help uncover hidden PHP errors and warnings that might otherwise go unnoticed.
Using a staging environment is another critical step. It allows you to test changes in a safe space without risking your live site or disrupting users.
Combining error logs with browser consoles provides a complete picture of both PHP and JavaScript issues, giving you the tools to tackle problems from multiple angles.
For more advanced troubleshooting, tools like WP Debugging, Debug Bar, Query Monitor, and even Xdebug can significantly enhance your ability to identify and resolve issues.
Finally, keeping your code clean and updated is essential for ensuring long-term stability and minimizing future problems.
Final Thoughts on WordPress Theme Maintenance
Regular maintenance is the best defense against major issues. This includes staying on top of updates, validating your code, creating backups, and monitoring security threats. These steps not only prevent problems but also make your site more resilient.
It’s also important to know when to call in the experts. Critical errors – like the infamous white screen of death, security breaches, or ongoing performance problems – often require specialized knowledge. Trying to fix these issues on your own can sometimes make things worse, especially if your site is critical to your business operations.
New tools, such as Developer Debug Tools, now offer real-time error notifications and monitoring, making it easier than ever to stay ahead of potential problems.
If an issue feels too complex to handle, services like WP Support Specialists can step in. Whether it’s an emergency fix or routine maintenance, their expertise allows you to focus on running your business while they handle the technical side.
FAQs
Why should I use a staging environment to debug WordPress themes?
Using a staging environment when debugging WordPress themes is a smart move. It gives you a safe space to test updates, experiment with new features, and troubleshoot problems without risking your live site. This way, your visitors can continue browsing without interruptions or errors while you work behind the scenes.
Beyond that, a staging environment simplifies the development process. It’s a great tool for team collaboration and catching issues early, before they make their way to the live site. By testing thoroughly in this controlled setup, you can keep your website stable and deliver a smooth experience for your users.
How do I check if a WordPress theme issue is caused by a plugin conflict?
How to Identify a WordPress Theme Issue Caused by a Plugin Conflict
If you’re dealing with a WordPress theme issue, one of the first steps is to check for a possible plugin conflict. Start by deactivating all plugins on your site. Then, reactivate them one by one, testing your site after each activation. If the problem resurfaces after enabling a specific plugin, you’ve likely found the culprit.
If deactivating plugins doesn’t resolve the issue, try switching to a default WordPress theme like Twenty Twenty-One. This can help you figure out whether the issue stems from your custom theme or a plugin.
You can also dig deeper by opening your browser’s developer tools to look for JavaScript errors or other script-related conflicts. These tools can provide valuable insights and help you troubleshoot more effectively. Taking these steps can streamline the process and make it easier to identify the root of the problem.
What tools can help debug complex WordPress theme issues, and how do they make troubleshooting easier?
Debugging Complex WordPress Theme Issues
When tackling tricky issues with your WordPress theme, having the right tools can make all the difference. Query Monitor is an excellent resource for this. It gives you a detailed look at database queries, PHP errors, hooks, and scripts. This makes it easier to spot conflicts or performance slowdowns that might be affecting your theme.
Another must-have tool is Xdebug. It works seamlessly with IDEs like VS Code or PhpStorm, allowing you to execute code step by step. This feature is invaluable for tracing problems in your theme’s code and understanding exactly where things are going wrong.
Both tools provide a deeper understanding of how your theme interacts with WordPress, giving you the clarity needed to identify and resolve issues effectively.