Is your WordPress site slowing down under pressure? Performance bottlenecks can frustrate users and hurt your revenue. This guide dives into the root causes – like slow database queries, PHP errors, and bloated assets – and provides actionable solutions to fix them.
Key Takeaways:
- Slow sites lose users and revenue. 53% of mobile users leave if a site takes over 3 seconds to load.
- Database issues are common culprits. Poorly indexed
wp_postmetatables and bloatedwp_optionscan slow queries. - PHP errors and memory limits matter. Outdated PHP versions and unoptimized code can crash your site.
- Asset loading impacts user experience. Large images and render-blocking scripts delay page loads.
Tools to Debug Issues:
- Query Monitor: Tracks slow queries, PHP errors, and hooks.
- Xdebug: Profiles code to pinpoint slow functions.
- Server Logs: Identifies crashes and server-side errors.
Quick Fixes:
- Optimize database queries by adding indexes and cleaning up bloat.
- Upgrade to PHP 8.x for faster response times.
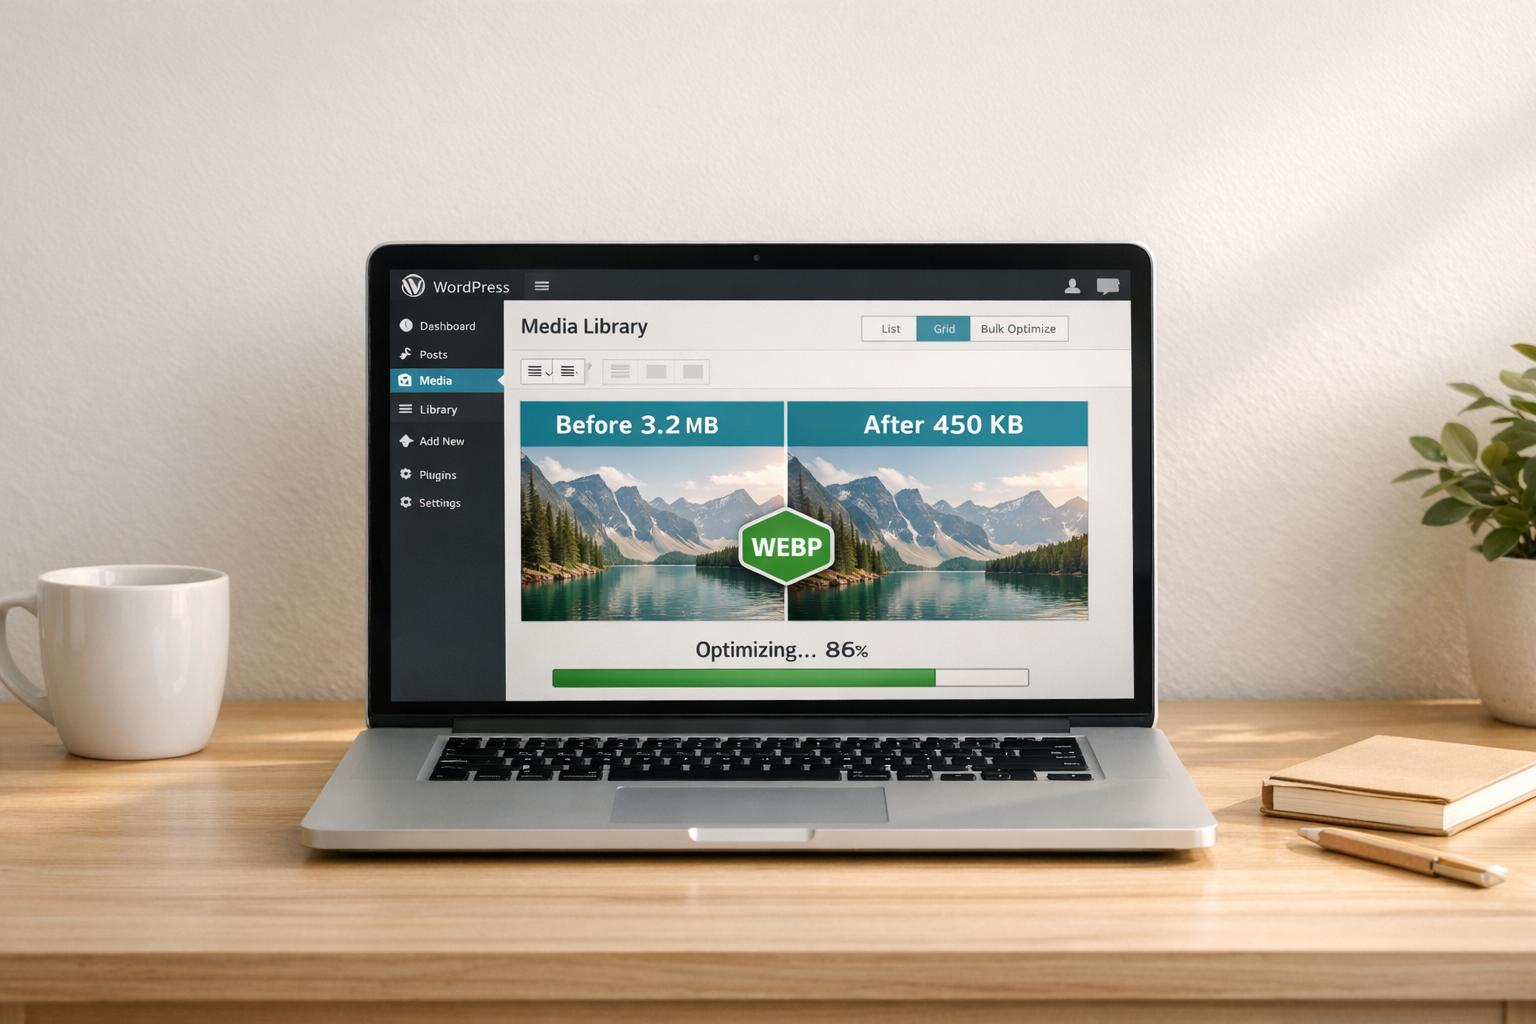
- Reduce asset sizes with lazy loading and modern formats like WebP.
- Use lightweight themes and disable unnecessary plugins.
Performance optimization isn’t a one-time task. Regular monitoring, database cleanups, and plugin audits are essential to keep your site fast as traffic grows. If managing this feels overwhelming, professional WordPress support services can help.
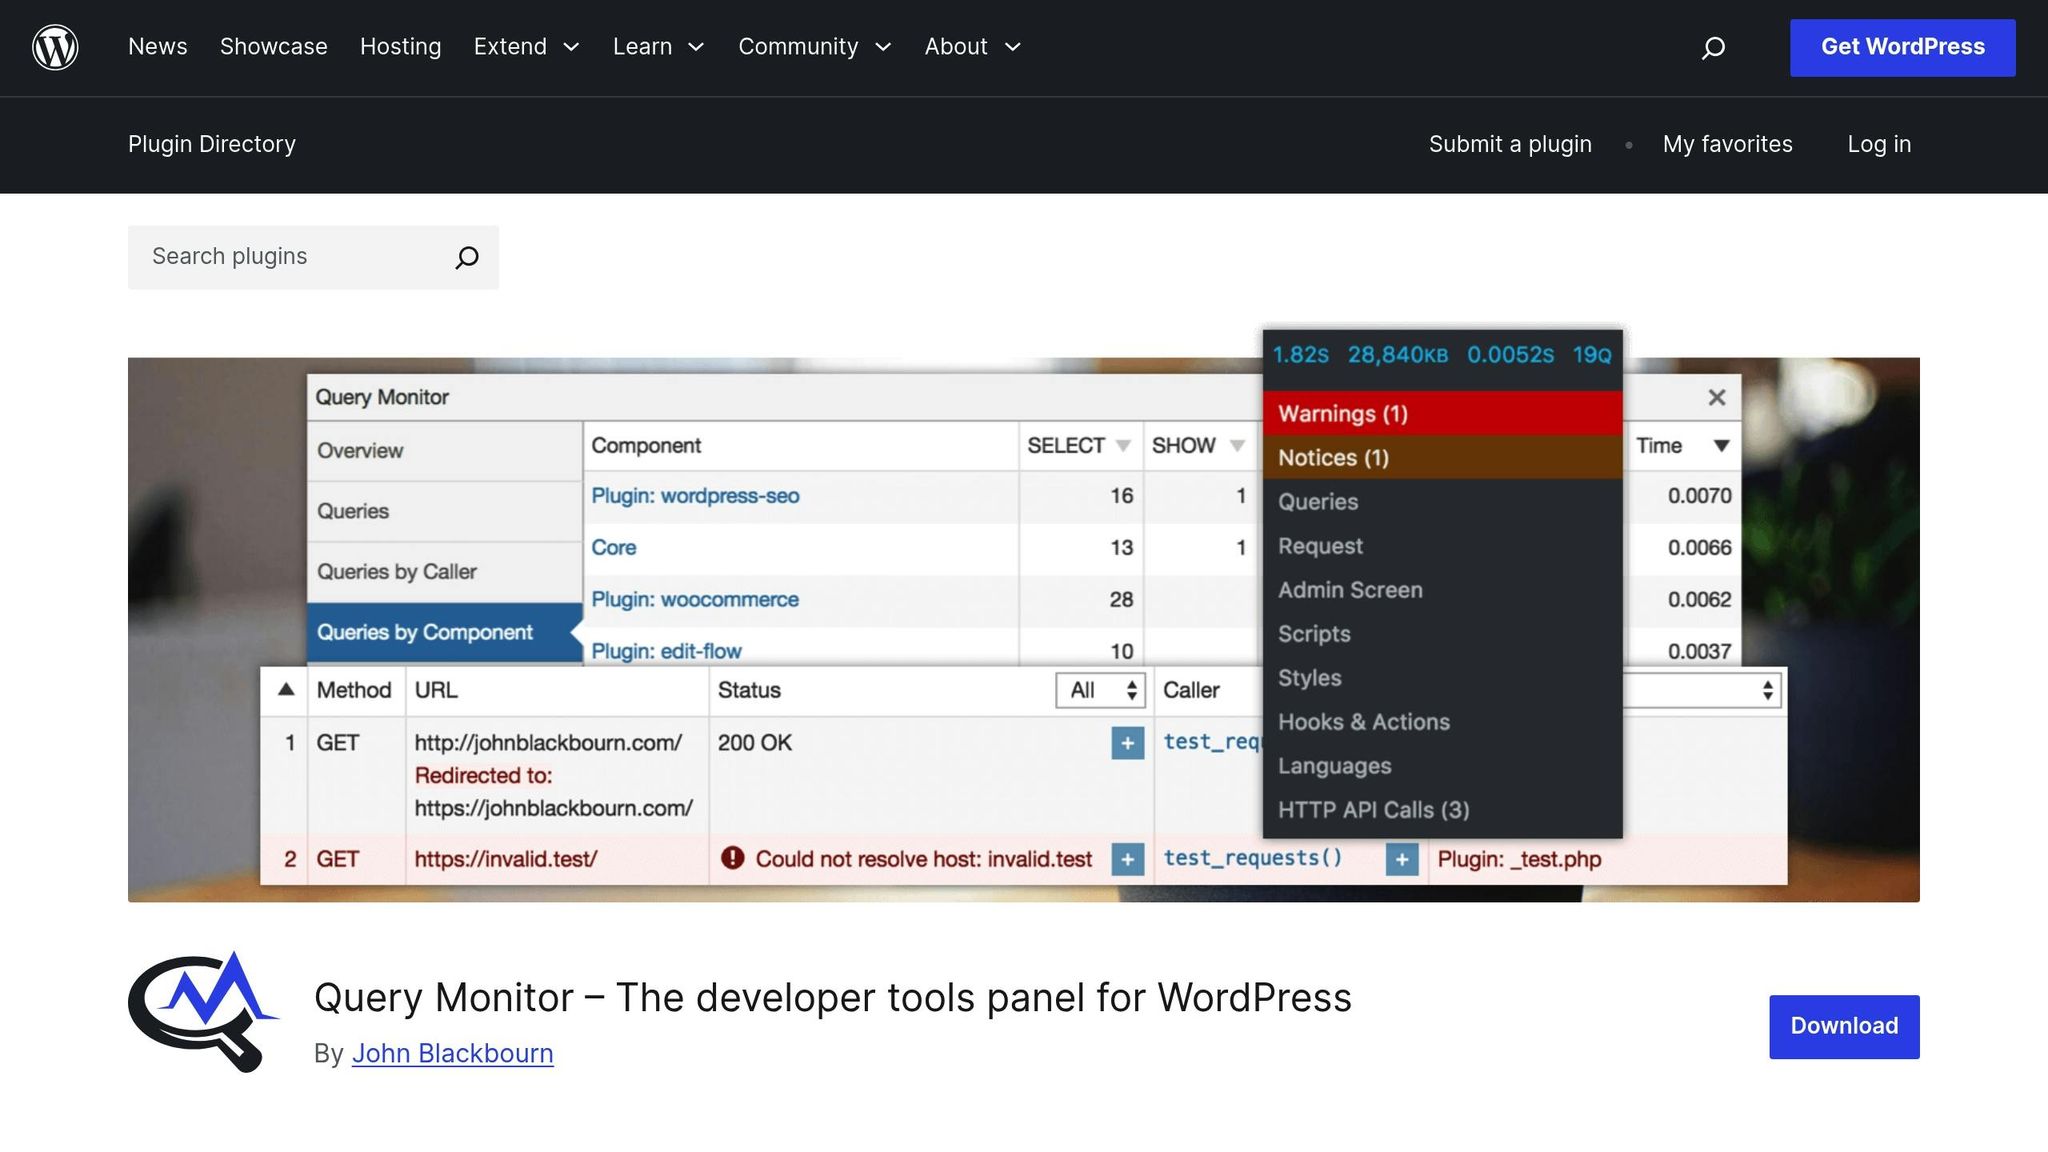
Query Monitor – Easily Debug and Improve WordPress Performance
Common WordPress Bottlenecks
WordPress bottlenecks often arise from slow database queries, PHP errors and memory limits, and heavy frontend assets. While each of these issues impacts your site differently, they all share a common thread: they start small but worsen as your site grows.
Database Query Problems
Every page load in WordPress relies on database queries, which can slow down significantly as your database grows. A common troublemaker is the wp_postmeta table, where custom fields and plugin settings are stored. Without proper indexing on columns like meta_key and meta_value, MySQL has to sift through every row to find what it needs – a process that becomes increasingly sluggish as more data accumulates.
"Slow queries were actually fast queries at one point – but as the site grew older, the query got slower and slower, unable to keep up with the expanding database."
– Andy Stratton, Developer
Take, for example, the CSS-Tricks team. In June 2015, they discovered a bottleneck on their Edit Post screen caused by a query fetching unique meta_keys from wp_postmeta. By replacing a GROUP BY statement with DISTINCT, they reduced query time from 1.77 seconds to 0.27 seconds. Adding a MySQL index to the meta_key column brought it down further to just 0.002 seconds. Similarly, a content-heavy site with 2 million rows in wp_postmeta saw query times drop from 180ms to 17ms after implementing a composite index on (meta_key, post_id) and limiting post revisions. This change improved their Time to First Byte (TTFB) by 45%.
Database bloat only adds to the problem. Elements like post revisions, expired transients in wp_options, spam comments, and orphaned metadata increase table size and slow down queries. The wp_options table is particularly problematic when overloaded with "autoload" entries, as WordPress loads this data on every single page request, potentially causing TTFB to spike from milliseconds to several seconds.
Next, let’s look at how PHP errors and memory limits can further impact your site’s performance.
PHP Errors and Memory Limits
PHP warnings and fatal errors can either degrade your site’s performance or take it offline entirely. Fatal errors are especially disruptive, as they stop WordPress from running – usually caused by calling a non-existent function or encountering a critical conflict. Warnings and notices, while less severe, still indicate underlying issues like undefined variables, which consume server resources and slow down performance when they occur frequently.
"A PHP fatal error stops WordPress from running. It means the code encountered a problem so serious it couldn’t continue."
– Remkus de Vries, WordPress Developer
Memory exhaustion is another major issue. If WordPress exceeds its PHP memory limit, the server struggles to complete requests, leading to crashes or long delays. For instance, in January 2026, Brian Jackson (founder of woorkup) identified a bottleneck caused by a corrupt transient cache related to the "gp-premium" plugin. This issue resulted in 695,846 rows of %wp_image_processing% data in the wp_options table, causing response times to skyrocket. After identifying the issue with New Relic and manually deleting the rows in a staging environment, response times returned to normal.
Upgrading your PHP version can also make a noticeable difference. PHP 7.2 is three times faster than PHP 5.6, and PHP 7.3 offers an additional 9% speed boost over PHP 7.2. For optimal performance, aim for a Time to First Byte (TTFB) of 800 milliseconds or less.
Now, let’s dive into how asset loading can become a bottleneck for user experience.
Asset Loading and Script Management
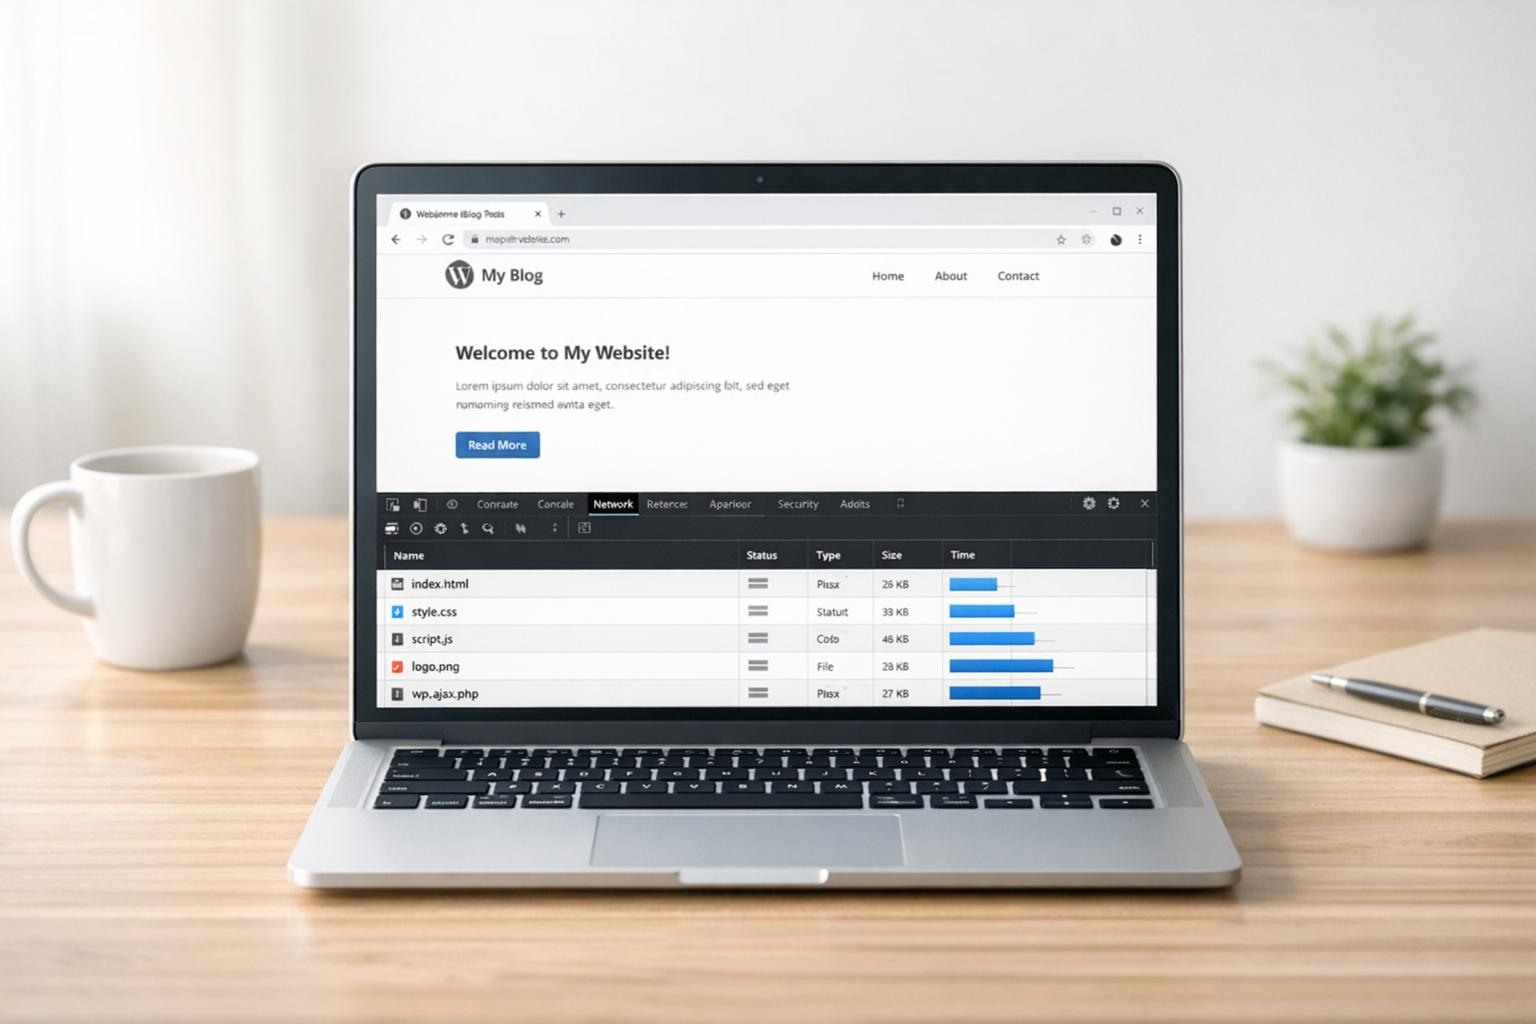
Frontend assets – like CSS, JavaScript, and images – are some of the most visible bottlenecks because they directly affect what users see and how quickly they see it. Each asset requires an HTTP request, which can overwhelm slower connections. Images often make up more than 50% of a page’s weight, making them a key focus for optimization.
Render-blocking resources are another common issue. When browsers encounter CSS and JavaScript files in the <head> section, they pause rendering until those files are downloaded and processed. Third-party scripts – such as ads, font loaders, and analytics – add external dependencies and extra execution time, often having an outsized impact on performance. These delays directly affect Core Web Vitals: Large images slow down Largest Contentful Paint (LCP), while unstable asset loading contributes to Cumulative Layout Shift (CLS).
The effects on user experience are both immediate and measurable. A 1-second delay in page load time can lead to a 7% drop in conversions, 11% fewer page views, and a 16% decline in customer satisfaction. With the average human attention span now around 8 seconds, fast initial load times are essential for keeping visitors engaged.
Tools for Debugging WordPress Bottlenecks
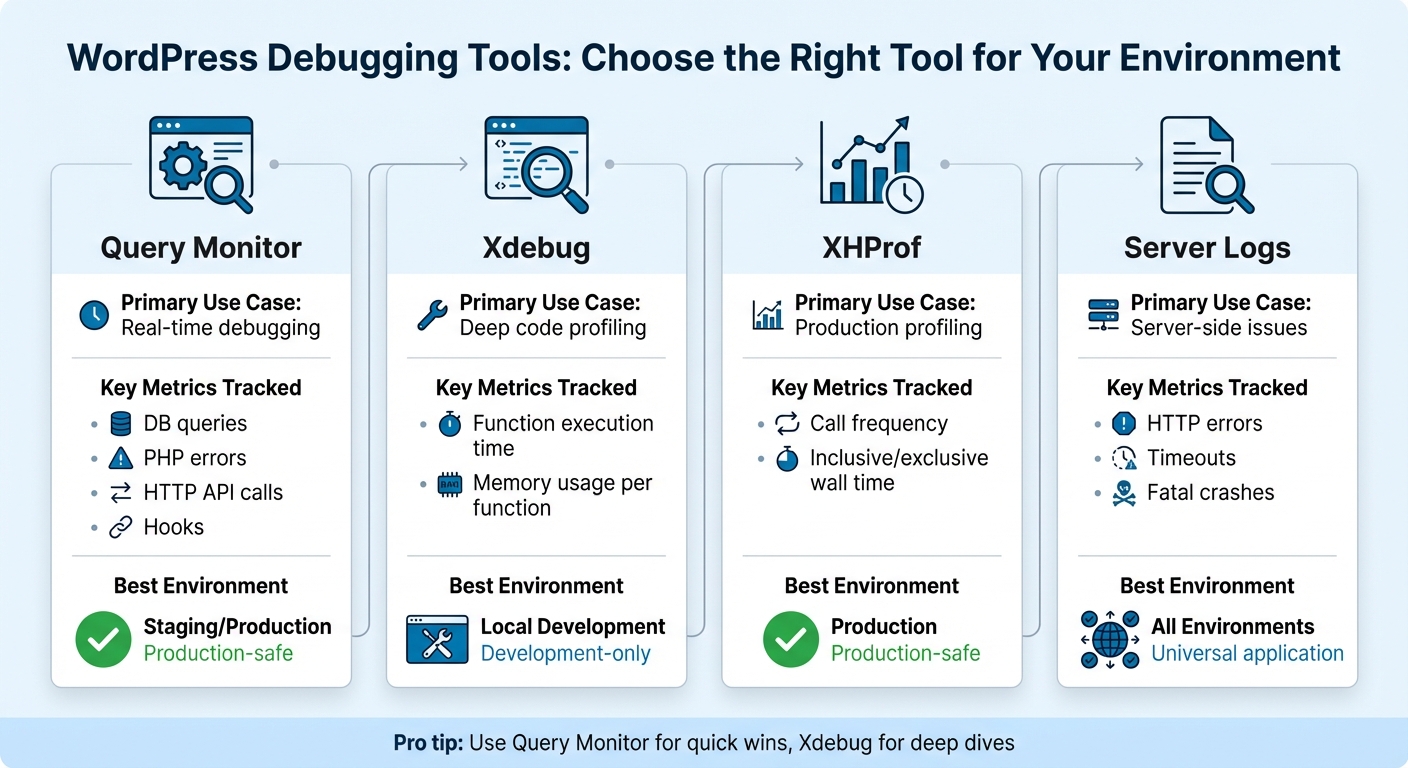
WordPress Debugging Tools Comparison: Features and Best Use Cases
Once you’ve identified performance issues, the next step is figuring out what’s causing them. The right debugging tools can turn WordPress into an open book, letting you monitor everything from database queries to PHP errors and server glitches in real time.
Query Monitor is a must-have plugin for tracking database queries, PHP errors, hooks, enqueued scripts, and HTTP API calls. Its "Queries by Component" feature is a standout – it pinpoints which plugin or theme is behind slow or duplicate queries. This eliminates the need for guesswork when identifying bottlenecks. If you’re dealing with autoloaded database options exceeding 1 MB, the Object Cache panel in Query Monitor can help. It tracks hit rates and highlights "Slow-Ops", which are operations taking more than 5ms.
For a more in-depth look at your code, profiling tools are invaluable. Xdebug, a PHP extension, allows you to profile your code and identify bottlenecks at the function level. By enabling xdebug.mode = profile in your php.ini file, you can create Cachegrind files to visualize which functions are consuming the most time and memory. Xdebug is ideal for local development, as it doesn’t interfere with live traffic. For production environments, XHProf is a lighter alternative. Paired with XHGui, it provides a graphical interface to analyze call frequency and memory usage with minimal performance impact.
Server log analysis is another critical tool, especially for issues WordPress might not catch. For example, if you’re facing a "White Screen of Death" or a 500 Internal Server Error, server logs often hold the key. You can enable WordPress-specific logs by setting WP_DEBUG_LOG to true in your wp-config.php file. These logs save PHP errors to /wp-content/debug.log. Additionally, server logs – found at /var/log/apache2/error.log for Apache or /var/log/nginx/error.log for Nginx – capture server-side crashes and configuration problems. To view real-time logs, use the tail -f /path/to/error.log command via SSH. This creates a "breadcrumb trail" that leads you directly to the problematic file and line of code.
| Tool | Primary Use Case | Key Metrics Tracked | Best Environment |
|---|---|---|---|
| Query Monitor | Real-time debugging | DB queries, PHP errors, HTTP API calls, Hooks | Staging/Production |
| Xdebug | Deep code profiling | Function execution time, memory usage per function | Local Development |
| XHProf | Production profiling | Call frequency, inclusive/exclusive wall time | Production |
| Server Logs | Server-side issues | HTTP errors, timeouts, fatal crashes | All Environments |
For production sites, it’s good practice to set WP_DEBUG_DISPLAY to false and WP_DEBUG_LOG to true. This ensures errors are logged without being displayed publicly. Remember to disable logging once you’re done debugging to maintain performance and security.
Next, dive into how you can use these tools effectively to measure and improve key performance metrics.
sbb-itb-976b402
How to Debug WordPress Performance Issues
To tackle WordPress performance problems, start by measuring key metrics, identifying the root cause, and applying targeted fixes. Without proper measurements, you might end up addressing the wrong issues. As George Prodromou from G7Cloud explains:
"Without measurements, it is very easy to chase the wrong thing. Many site owners spend hours deleting images or tweaking plugins when the real issue is an overloaded server or a slow external script."
Measuring Performance Metrics
When testing your site, avoid relying on caching. Caching can disguise deeper issues, making your site seem faster than it truly is. WordPress performance expert Remkus de Vries emphasizes:
"Caching doesn’t solve performance problems. It just hides it really well."
Focus on key performance indicators like Core Web Vitals:
- LCP (Largest Contentful Paint): Aim for under 2.5 seconds.
- CLS (Cumulative Layout Shift): Keep it below 0.1.
- INP (Interaction to Next Paint): Target under 200 milliseconds.
On the backend, Time to First Byte (TTFB) is a critical metric. A good TTFB for cached pages is below 200–300ms, while dynamic pages should stay under 800ms. If TTFB spikes during high traffic, it’s often a sign that your server is hitting CPU or RAM limits.
Use tools like GTmetrix or WebPageTest to analyze your site’s loading sequence. Identify bottlenecks such as render-blocking scripts, oversized images, or slow third-party widgets. Make sure to test with mobile profiles and throttled 3G/4G speeds for a realistic view of performance.
| Metric | Target Threshold | What It Measures |
|---|---|---|
| TTFB | < 500ms (Ideal < 200ms) | Server response time |
| LCP | < 2.5 seconds | Main content visibility |
| CLS | < 0.1 | Visual stability |
| INP | < 200ms | Responsiveness to interactions |
| Page Weight | < 2 MB | Total size of page assets |
Once you’ve gathered baseline metrics, shift your attention to backend performance.
Debugging Database Performance
Database performance issues are often the hidden culprits behind slow sites. Start by enabling slow query logs in your MySQL configuration, setting a threshold of 0.5 seconds to capture problematic queries. Use tools like Query Monitor to trace these queries back to specific plugins or themes.
For deeper analysis, run EXPLAIN on slow queries to examine execution plans. If you see full table scans instead of indexed queries, you’ve likely found the problem.
The wp_options table is another common trouble spot. Data with autoload = 'yes' loads into memory on every page request. To prevent performance lags, check for autoloaded options exceeding 1 MB. Use a SQL query to identify the top 20 largest autoloaded entries and set autoload to ‘no’ for non-essential data.
Other optimizations include limiting post revisions by adding define('WP_POST_REVISIONS', 3); to your wp-config.php file. For sites with large wp_postmeta tables, adding a composite index on (meta_key, post_id) can significantly speed up metadata lookups.
With database issues addressed, turn your attention to the frontend.
Optimizing Frontend Performance
Images often make up more than half of a page’s total size. Switch to modern formats like WebP or AVIF to reduce file sizes. Enabling lazy loading ensures offscreen images, videos, and comments only load as users scroll.
To eliminate render-blocking resources, defer non-essential JavaScript using the defer or async attributes. This prevents scripts like analytics or social widgets from delaying page rendering. Inline critical CSS for above-the-fold content to speed up the first paint.
A script manager like Perfmatters can help you disable unnecessary plugins. For instance, in October 2025, Remkus de Vries resolved a performance issue caused by a GeneratePress plugin that was overloading admin-ajax.php. By identifying and manually deleting corrupt rows in the wp_options table via SQL, he quickly restored the site’s performance.
Use lightweight themes like Astra, GeneratePress, Blocksy, or Kadence. If your site relies on heavy page builders like Elementor or Divi, converting to native Gutenberg blocks can reduce frontend bloat. Finally, upgrading to PHP 8.x can improve server response times by 20–30% compared to older versions.
Preventing Future Bottlenecks
Addressing current issues is just the beginning; the true challenge lies in maintaining your site’s performance as it scales. Without consistent upkeep, problems like database bloat, outdated plugins, and infrastructure weaknesses can resurface, especially during traffic surges.
Regular Monitoring and Maintenance
Routine updates are your first line of defense. WordPress core, PHP, themes, and plugins often include performance improvements and bug fixes, but simply updating isn’t enough. You’ll need to ensure these updates don’t introduce new issues.
Keeping your database clean is essential for maintaining speed. Over time, spam comments, post revisions, and transient data can pile up, slowing down query responses. Aim to keep autoloaded options in the wp_options table under 800kb and flag any database query that consistently takes longer than 100ms to execute. Tools like WP Crontrol can help you reschedule heavy background tasks to off-peak hours, reducing CPU and RAM usage during busy times.
Quarterly plugin audits are also crucial. Unused or inactive plugins can add unnecessary strain to your server. For example, in January 2026, Brian Jackson, founder of the blog woorkup, discovered that the "gp-premium" plugin had created 695,846 corrupt transient rows in the wp_options table, significantly slowing down his site. Using New Relic, he identified the issue, ran a targeted SQL query in a staging environment, and restored normal performance. Tools like Application Performance Monitoring (APM) make this kind of troubleshooting easier by tracking metrics like load times, error rates, and throughput in real time.
Always test changes in a staging environment before pushing them live. This step ensures that performance issues don’t make their way to your production site. Many premium hosting providers offer monitoring services that check your site’s status every three minutes, helping to catch failures quickly.
If managing these tasks internally feels overwhelming, external support can help.
Working with Professional WordPress Support Services
Handling ongoing maintenance tasks can stretch internal teams thin, especially as your site grows. Professional WordPress support services bring the expertise and tools needed to manage these complexities. They monitor your site continuously, track detailed metrics like Apdex scores and server load times, and identify when adjustments – like adding more PHP threads or isolating software containers – are necessary.
WP Support Specialists, for instance, offers maintenance plans that include 24/7 uptime monitoring, automated backups, plugin and core updates, security checks, and speed optimization. Their pricing starts at $78 per month for basic sites and goes up to $383 per month for custom or e-commerce sites requiring daily backups and rapid response times. Agencies can even partner with them through white-label services to offer these plans under their own brand.
Expert teams use tools like New Relic and Kinsta APM to dig into the root causes of performance issues, such as poorly coded plugins or scripts. As Brian Jackson puts it:
"There is no architecture or host that exists that will magically fix bad code."
These services also address technical debt by cleaning up databases, improving mobile performance, and delivering weekly analytics reports to monitor growth. By staying proactive, they help prevent scalability problems, ensuring your site remains fast and reliable as traffic increases.
Conclusion
When tackling WordPress performance bottlenecks, a step-by-step approach is key. Start by isolating issues in a staging environment and focus on impactful solutions, such as addressing slow database queries and enabling object caching. As Remkus de Vries aptly puts it:
"WordPress is telling you what’s wrong; you just have to learn to listen."
The tools outlined in this guide – like WP_DEBUG, Query Monitor, Xdebug, and server log analysis – offer the insights needed to pinpoint and resolve performance issues. Aim for a backend TTFB (Time to First Byte) under 200ms and a frontend LCP (Largest Contentful Paint) below 2.5 seconds. Upgrading to PHP 8.x can significantly boost server response times, cutting them by 20% to 30%, while optimizing images is crucial since they often make up more than 50% of a page’s total size.
Performance optimization isn’t a one-time task – it requires consistent upkeep. Regular database cleanups, quarterly reviews of plugins, and ongoing monitoring are essential to keep bottlenecks at bay. Keep an eye on autoloaded options and ensure they stay under 800kb. These practices will help your site stay fast and efficient as your traffic grows.
If your team lacks the bandwidth to manage these tasks, professional WordPress support services can step in to handle the heavy lifting. For expert help tailored to your needs, consider reaching out to WP Support Specialists – they can help ensure your site remains fast, stable, and ready to scale.
FAQs
How can I tell if my WordPress site is experiencing database performance issues?
Database performance issues can manifest in several ways: sluggish page load times, high Time-to-First-Byte (TTFB), spikes in CPU usage, or memory overload – even when caching is enabled. These signs often indicate that your database is struggling to manage the workload effectively.
To identify the root cause, tools like Query Monitor or Debug Bar can be incredibly helpful. These plugins provide insights into slow database queries, memory consumption, and object-cache performance. Pay attention to any flagged queries that are slow or inefficient, and track them back to the specific theme, plugin, or database structure causing the issue.
Some frequent troublemakers include missing indexes, poorly configured WP_Query parameters, or oversized autoloaded options in the wp_options table. Addressing these can make a noticeable difference. For example, cleaning up unnecessary transients, reducing excessive post revisions, or fine-tuning database queries can significantly improve performance. If the problem persists, reaching out to WP Support Specialists for advanced diagnostics and database optimization might be the best course of action to keep your site running smoothly.
What are the advantages of upgrading to PHP 8.x for WordPress?
Upgrading to PHP 8.x can make a noticeable difference in how your WordPress site performs. With faster code processing, your pages load quicker, which not only boosts user experience but can also positively impact your SEO rankings.
On top of that, PHP 8.x uses server resources more efficiently. This means your site can manage higher traffic levels without overloading your hosting plan. Plus, it comes with the latest security updates, offering stronger protection against potential vulnerabilities.
How can I make images load faster on my WordPress site?
To make your WordPress site load images faster, here are some steps you can take:
- Resize images before uploading: Adjust your images to match the exact dimensions needed on your site. For example, if your site uses a full-width banner, set the image width to 1200 pixels. This prevents browsers from doing extra resizing work.
- Choose the right file format: Use JPEG for photos, PNG for graphics with transparency, and WebP for better compression that keeps quality intact.
- Compress image files: Tools or plugins designed for image optimization can shrink file sizes without sacrificing how they look.
- Enable lazy loading: This ensures images load only when they’re about to be visible on the screen, which can significantly cut down initial load times.
These techniques will speed up your site, provide a smoother experience for visitors, and even help with your SEO rankings.